Heikin-Ashi, also sometimes spelled Heiken-Ashi, means “average bar” in Japanese. The Heikin-Ashi technique can be used in conjunction with candlestick charts when trading securities to spot market trends and predict future prices. It’s useful for making candlestick charts more readable and trends easier to analyze. For example, traders can use Heikin-Ashi charts to know when to stay in trades while a trend persists but get out when the trend pauses or reverses. Most profits are generated when markets are trending, so predicting trends correctly is necessary.
The Heikin-Ashi Formula
Normal candlestick charts are composed of a series of open-high-low-close (OHLC) candles set apart by a time series. The Heikin-Ashi technique shares some characteristics with standard candlestick charts but uses a modified formula of close-open-high-low (COHL):
Close=41 (Open+Close+Low+Close)(The average price of the current bar)Open=21 (Open of Prev. Bar+Close of Prev. Bar)(The midpoint of the previous bar)High=Max[High, Open, Close]Low=Min[Low, Open, Close]
Heikin-Ashi: A Better Candlestick
Constructing the Chart
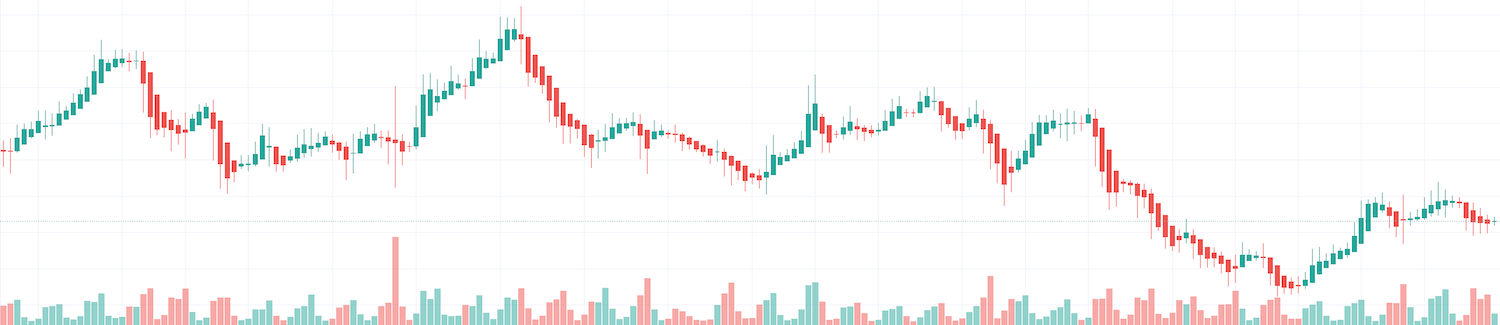
The Heikin-Ashi chart is constructed like a regular candlestick chart, except the formula for calculating each bar is different, as shown above. The time series is defined by the user, depending on the type of chart desired, such as daily, hourly or five-minute intervals. The down days are represented by filled candles, while the up days are represented by empty candles. These can also be colored in by the chart platform, so up days are white or green, and down days are red or black, for example.
There are a few differences to note between the two types of charts, and they’re demonstrated by the charts above. Heikin-Ashi has a smoother look, as it is essentially taking an average of the movement. There is a tendency with Heikin-Ashi for the candles to stay red during a downtrend and green during an uptrend, whereas normal candlesticks alternate color even if the price is moving dominantly in one direction.
The price scale is also of note. The current price shown on a normal candlestick chart will also be the current price of the asset, and that matches the closing price of the candlestick (or current price if the bar hasn’t closed). Since Heikin-Ashi is taking an average, the current price on the candle may not match the price the market is actually trading at. For this reason, many charting platforms show two prices on the y-axis: one for the calculation of the Heiken-Ashi and another for the current price of the asset.
Putting It to Use
These charts can be applied to any market. Most charting platforms have Heikin-Ashi charts included as an option.
There are five primary signals that identify trends and buying opportunities:
- Hollow or green candles with no lower “shadows” indicate a strong uptrend: Let your profits ride!
- Hollow or green candles signify an uptrend: You might want to add to your long position and exit short positions.
- Candles with a small body surrounded by upper and lower shadows indicate a trend change: Risk-loving traders might buy or sell here, while others will wait for confirmation before going long or short.
- Filled or red candles indicate a downtrend: You might want to add to your short position and exit long positions.
- Filled or red candles with no higher shadows identify a strong downtrend: Stay short until there’s a change in trend.
These signals may make locating trends or trading opportunities easier than with traditional candlesticks. The trends are not interrupted by false signals as often and are thus more easily spotted.
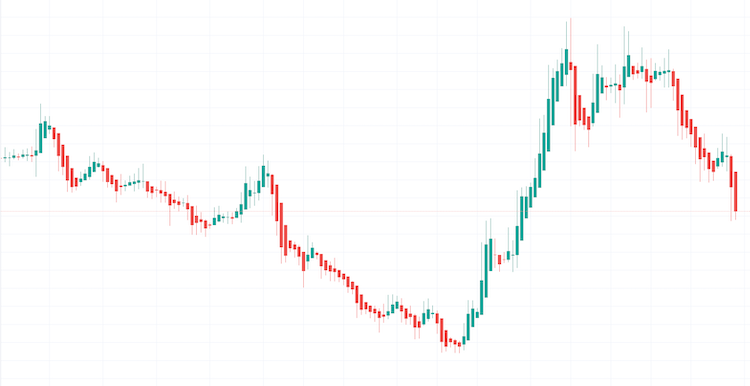
The chart example above shows how Heikin-Ashi charts can be used for analysis and making trading decisions. On the left, there are long red candles, and at the start of the decline, the lower wicks are quite small. As the price continues to drop, the lower wicks get longer, indicating that the price dropped but then was pushed back up. Buying pressure is starting to build. This is followed by a strong move to the upside.
The upward move is strong and doesn’t give major indications of a reversal, until there are several small candles in a row, with shadows on either side. This shows indecision. Traders can look at the bigger picture to help determine whether they should go long or short.
The charts can also be used to keep a trader in a trade once a trend begins. It’s usually best to stay in a trade until the Heikin-Ashi candles change color. A change of color doesn’t always mean the end of a trend—it could just be a pause.